Team projects tagged 2025
Reading 1,800 survey comments without reading 1,800 comments
Headline finding: Three themes covered 71% of comments; cost was named twice as often as opening hours
Coded two years of open-ended community survey answers into a small set of themes, and published the codebook so the next survey can be compared with this one.
- Qualitative coding
- Python
- scikit-learn
- 1 more methods & tools
Skills practiced: Data cleaning Skills practiced: Stakeholder interviews1 moreLast confirmed Sep 2025
 Essentials
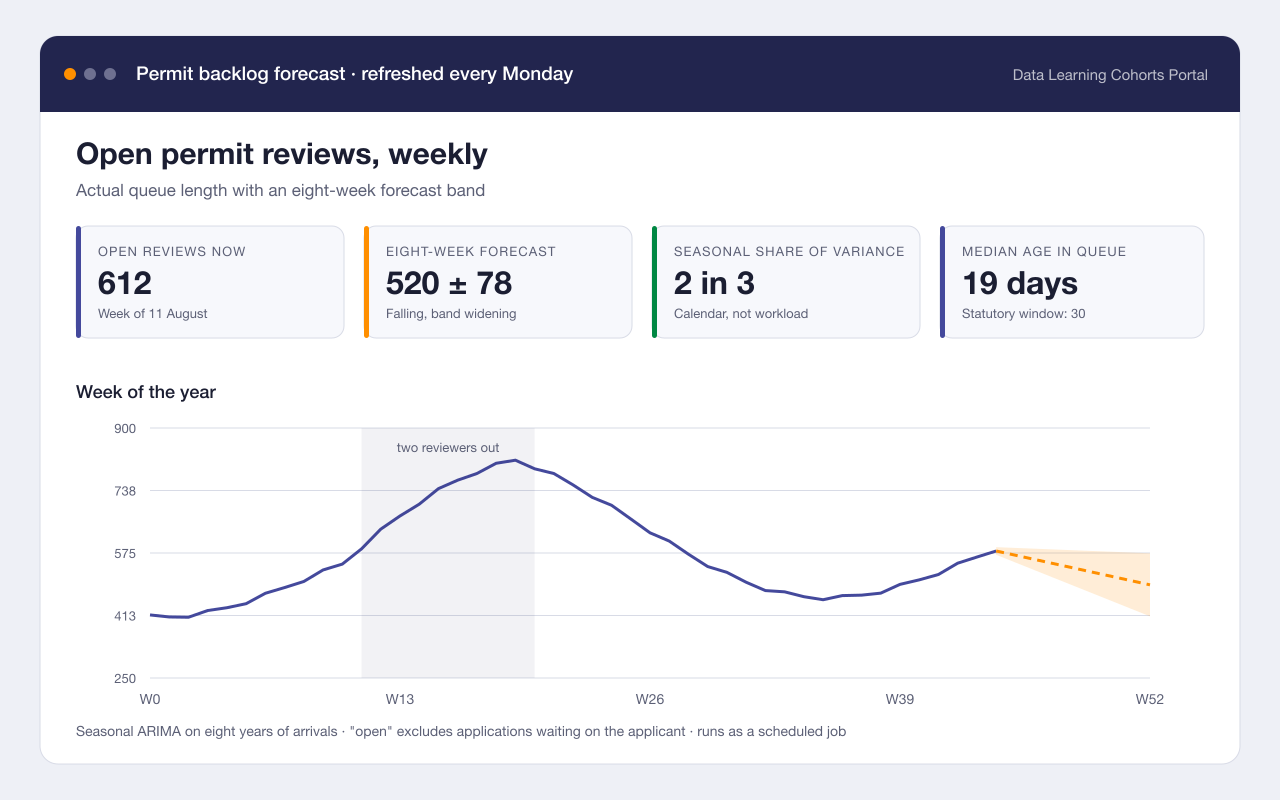
Forecasting the permit review backlog
Headline finding: A two-week staffing dip in March explained most of the backlog that was still there in July
Built a weekly forecast of the permit review queue so the licensing team can see a backlog forming instead of discovering it two months later.
- Time series
- Python
- 2 more methods & tools
Skills practiced: Statistics Skills practiced: Automation1 more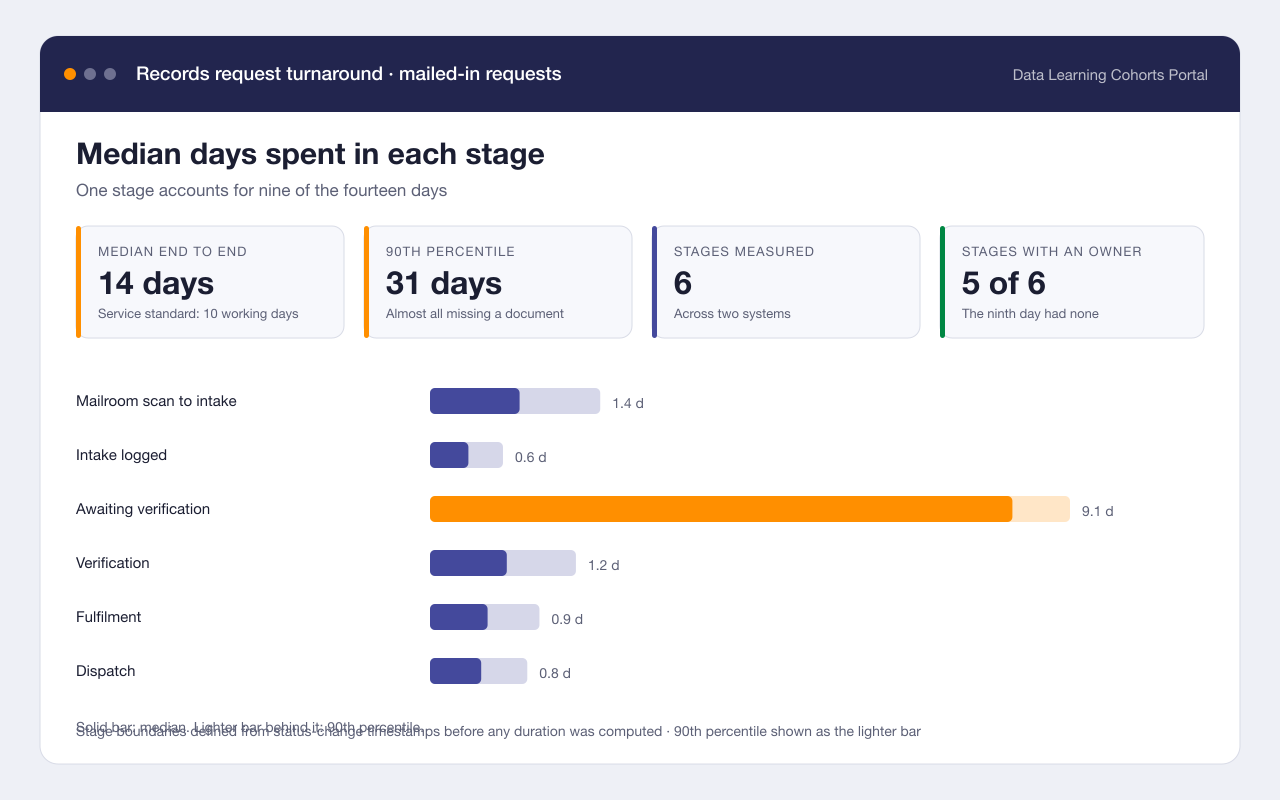 Civic
CivicWhere the two weeks go in a records request
Headline finding: Mail-in requests spent 9 of their 14 days in a single hand-off between two systems
Reconstructed the full path of a mailed-in vital records request from timestamps and found that most of the wait happened in a queue nobody owned.
- Process mining
- SQL
- 2 more methods & tools
Skills practiced: Data cleaning Skills practiced: Automation2 moreLast confirmed Jun 2025