Data Learning Cohorts
What our teams built with data
Browse capstone projects from every cohort — the question each team asked, the methods they used, and the dashboards, posters and write-ups they produced.
6 team projects 2 cohorts 5 with interactive dashboard
Browse by
Find team projects the way you think about them
Featured team projects
 Featured Storytelling
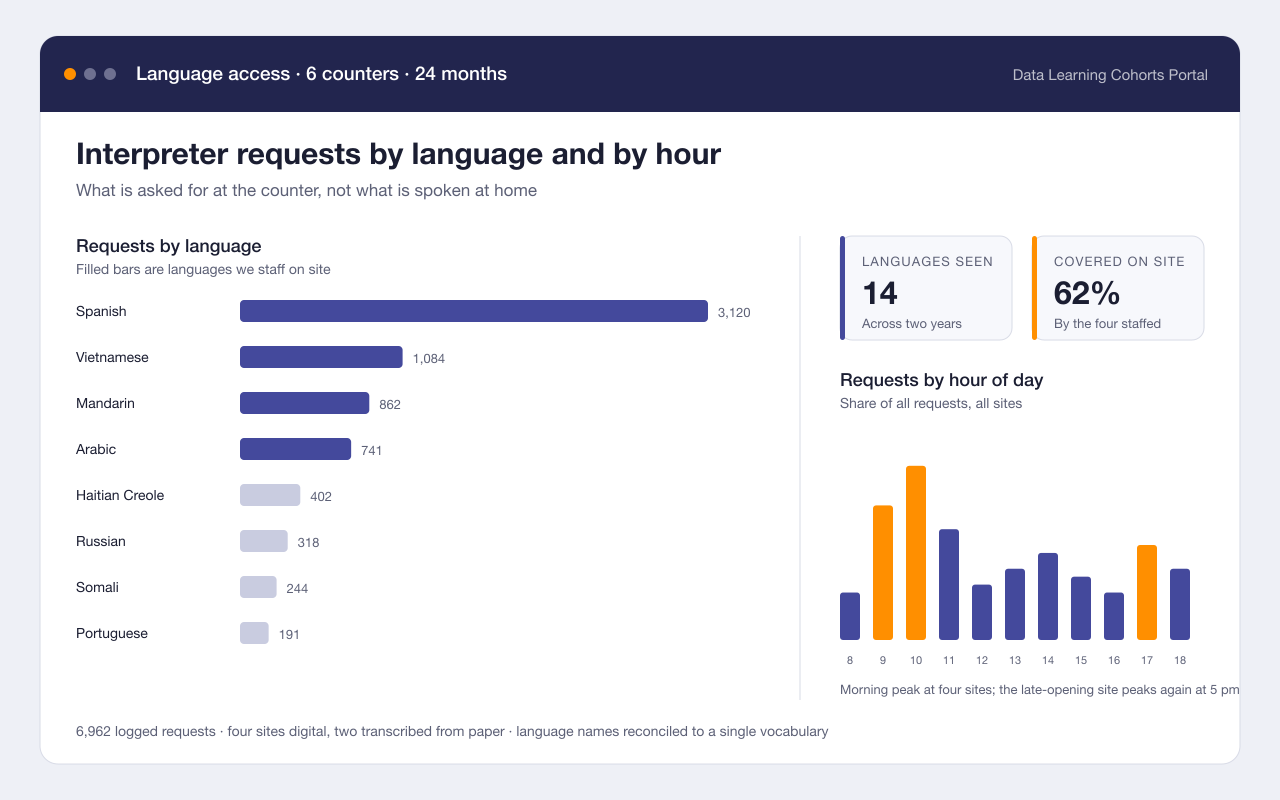
Which languages our front counters actually need
Headline finding: Requests named 14 languages; the four we staffed for covered 62% of them
Turned two years of interpreter request logs into a dashboard that shows which languages are asked for, at which counters, and at which hours.
- Tableau
- SQL
- 2 more methods & tools
Skills practiced: Visualization Skills practiced: Stakeholder interviews1 more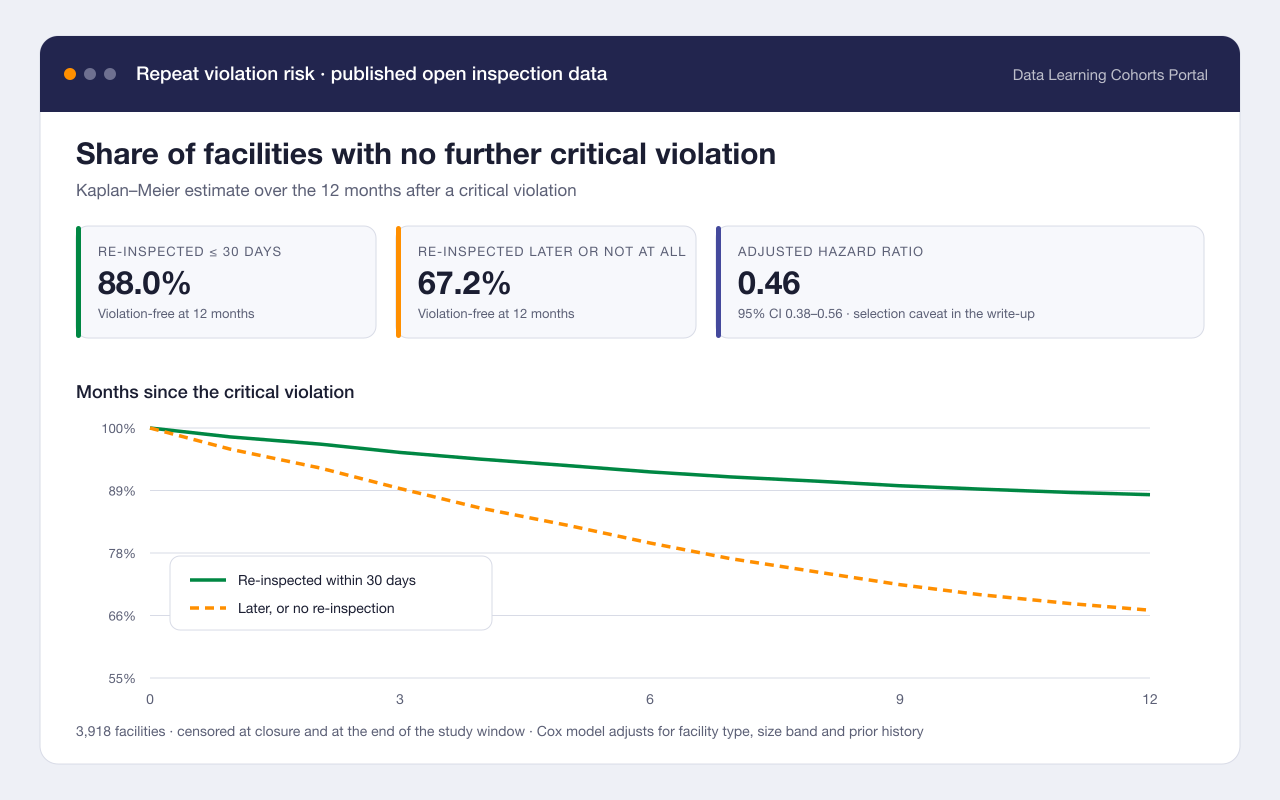 Featured Civic
How soon does a critical violation come back?
Headline finding: A re-inspection within 30 days cut the one-year repeat rate from roughly one in three to one in eight
Measured how long facilities go after a critical inspection violation before the next one, and whether an early re-inspection changes that.
- Survival analysis
- Python
- 2 more methods & tools
Skills practiced: Statistics Skills practiced: Data cleaning1 more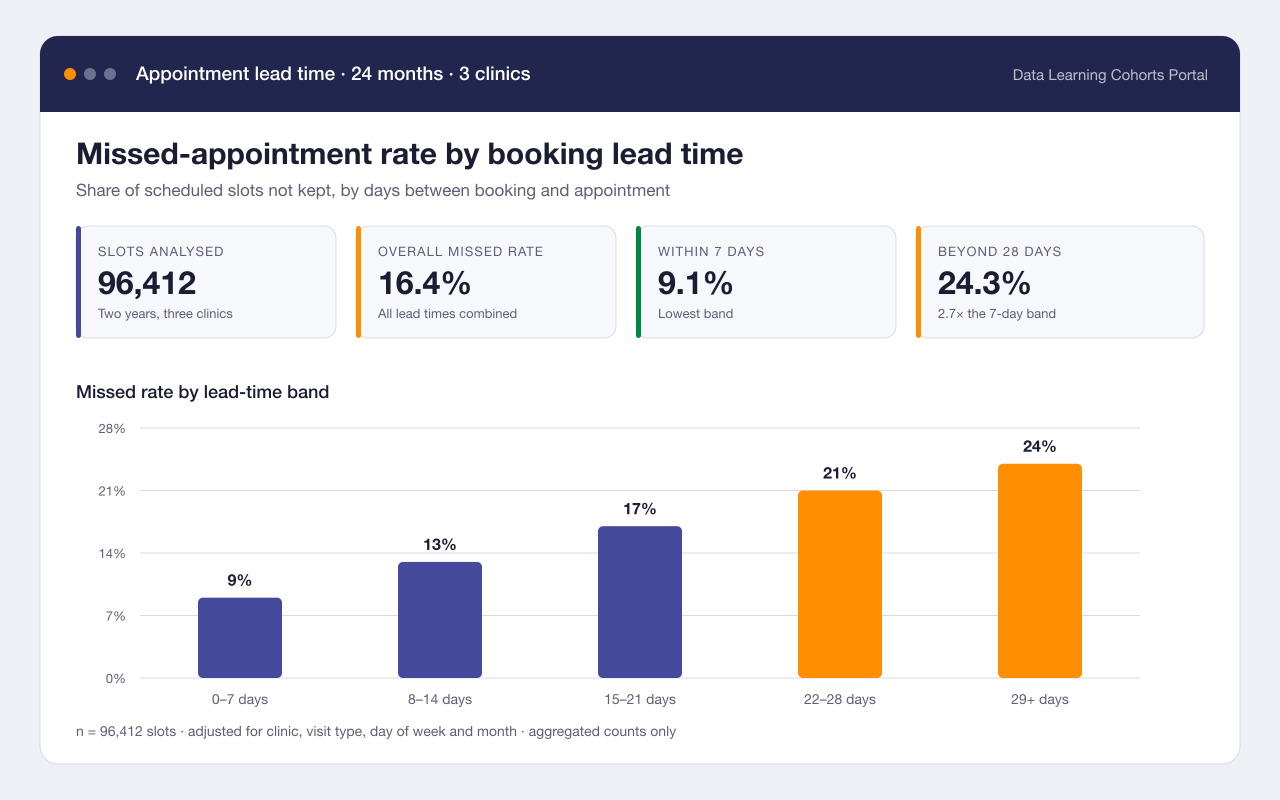 Essentials
Booking lead time and missed appointments
Headline finding: Appointments booked more than three weeks out were missed almost twice as often as those booked within a week
Tested whether how far ahead an appointment is booked predicts whether it is kept, using two years of de-identified scheduling counts from three community clinics.
- Logistic regression
- R
- 2 more methods & tools
Skills practiced: Data cleaning Skills practiced: Statistics1 moreReading 1,800 survey comments without reading 1,800 comments
Headline finding: Three themes covered 71% of comments; cost was named twice as often as opening hours
Coded two years of open-ended community survey answers into a small set of themes, and published the codebook so the next survey can be compared with this one.
- Qualitative coding
- Python
- scikit-learn
- 1 more methods & tools
Skills practiced: Data cleaning Skills practiced: Stakeholder interviews1 moreLast confirmed Sep 2025
 Essentials
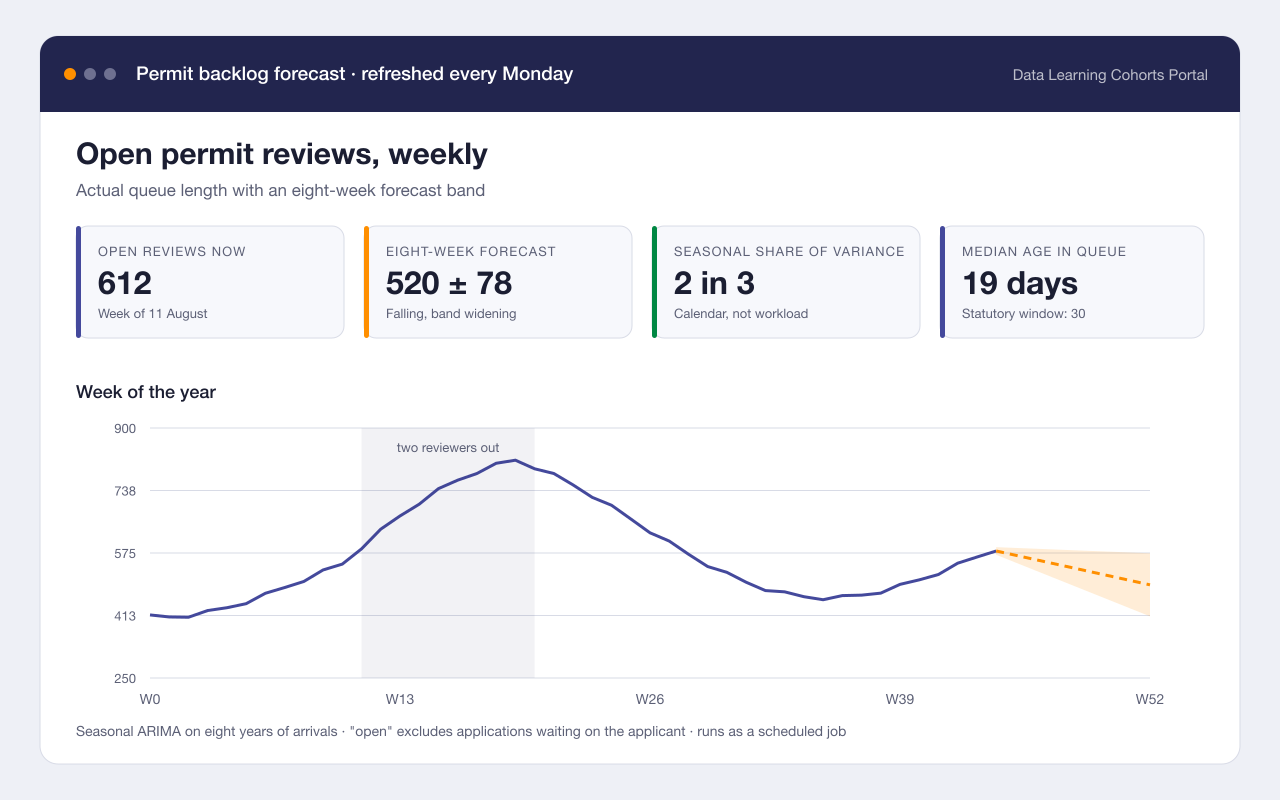
Forecasting the permit review backlog
Headline finding: A two-week staffing dip in March explained most of the backlog that was still there in July
Built a weekly forecast of the permit review queue so the licensing team can see a backlog forming instead of discovering it two months later.
- Time series
- Python
- 2 more methods & tools
Skills practiced: Statistics Skills practiced: Automation1 more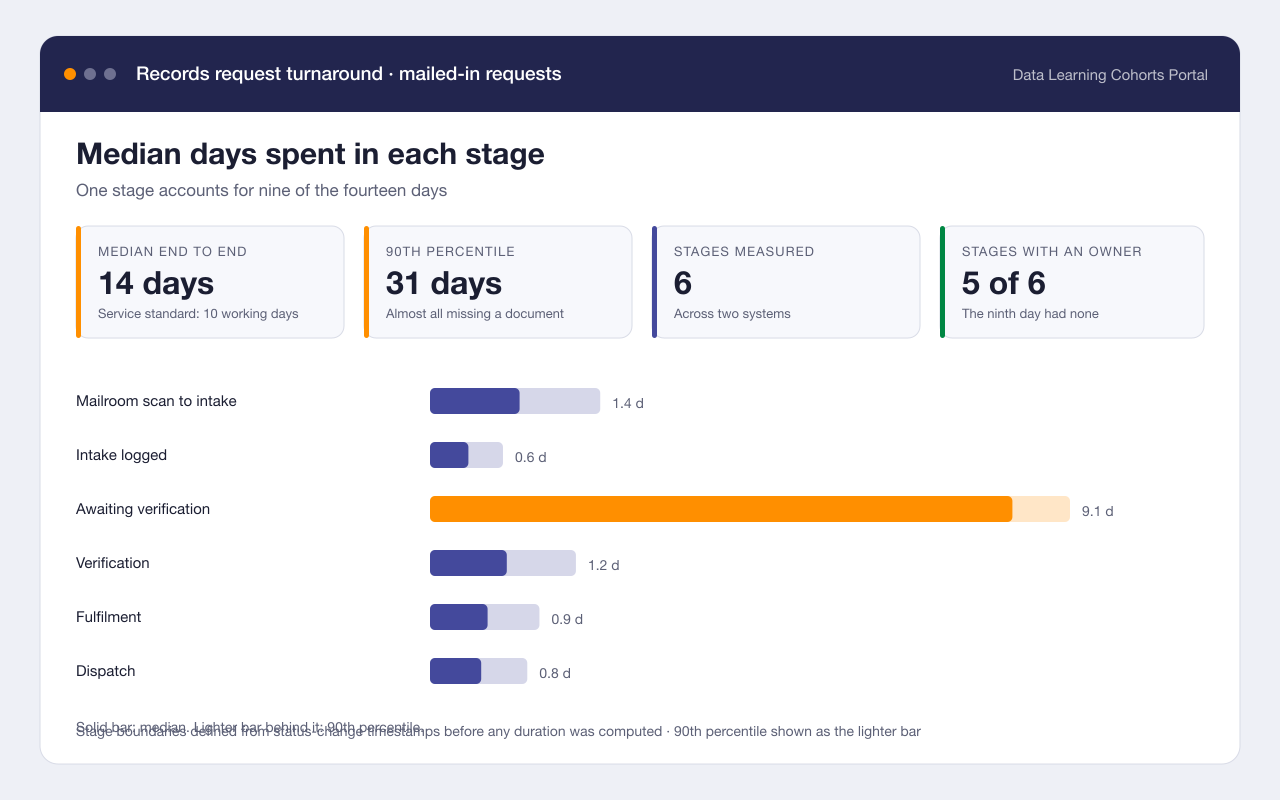 Civic
CivicWhere the two weeks go in a records request
Headline finding: Mail-in requests spent 9 of their 14 days in a single hand-off between two systems
Reconstructed the full path of a mailed-in vital records request from timestamps and found that most of the wait happened in a queue nobody owned.
- Process mining
- SQL
- 2 more methods & tools
Skills practiced: Data cleaning Skills practiced: Automation2 moreLast confirmed Jun 2025
Recently added
Browse all 6 team projects-
Featured Storytelling
Which languages our front counters actually need
Headline finding: Requests named 14 languages; the four we staffed for covered 62% of them
Turned two years of interpreter request logs into a dashboard that shows which languages are asked for, at which counters, and at which hours.
- Tableau
- SQL
- 2 more methods & tools
Skills practiced: Visualization Skills practiced: Stakeholder interviews1 more -
Featured Civic
How soon does a critical violation come back?
Headline finding: A re-inspection within 30 days cut the one-year repeat rate from roughly one in three to one in eight
Measured how long facilities go after a critical inspection violation before the next one, and whether an early re-inspection changes that.
- Survival analysis
- Python
- 2 more methods & tools
Skills practiced: Statistics Skills practiced: Data cleaning1 more -
Essentials
Booking lead time and missed appointments
Headline finding: Appointments booked more than three weeks out were missed almost twice as often as those booked within a week
Tested whether how far ahead an appointment is booked predicts whether it is kept, using two years of de-identified scheduling counts from three community clinics.
- Logistic regression
- R
- 2 more methods & tools
Skills practiced: Data cleaning Skills practiced: Statistics1 more Reading 1,800 survey comments without reading 1,800 comments
Headline finding: Three themes covered 71% of comments; cost was named twice as often as opening hours
Coded two years of open-ended community survey answers into a small set of themes, and published the codebook so the next survey can be compared with this one.
- Qualitative coding
- Python
- scikit-learn
- 1 more methods & tools
Skills practiced: Data cleaning Skills practiced: Stakeholder interviews1 moreLast confirmed Sep 2025
-
Essentials
Forecasting the permit review backlog
Headline finding: A two-week staffing dip in March explained most of the backlog that was still there in July
Built a weekly forecast of the permit review queue so the licensing team can see a backlog forming instead of discovering it two months later.
- Time series
- Python
- 2 more methods & tools
Skills practiced: Statistics Skills practiced: Automation1 more -
Civic
Where the two weeks go in a records request
Headline finding: Mail-in requests spent 9 of their 14 days in a single hand-off between two systems
Reconstructed the full path of a mailed-in vital records request from timestamps and found that most of the wait happened in a queue nobody owned.
- Process mining
- SQL
- 2 more methods & tools
Skills practiced: Data cleaning Skills practiced: Automation2 moreLast confirmed Jun 2025
Upcoming events
Full calendar-
Applications close for the 2027 cohort Deadline
-
Data clinic drop-in Session
2:00–4:00 PM Training room 2
Cohorts
All cohorts- Cohort 20263 team projects
- Cohort 20253 team projects
Real questions, real data
Every team picks a question that matters to their own area of work and works it end to end with coaching.
Methods and code you can borrow
Projects document their data sources and methods so the next cohort can start from what already works.
A growing body of practice
Filter by cohort year, area of work or track to see how the program has grown.
Share a team project
Fill out a short form. Maintainers review every submission before it goes live.