Data Learning Cohort 2025
The first cohort. Three teams, three questions their own areas had been arguing about, and the templates the programme still runs on.
The 2025 cohort set the shape of the programme: monthly sessions, a coach per team, and a published project page as the deliverable. Two of the three projects are still in service, and the analysis-plan template written during this cohort is the one every team has used since.
3 team projects of 3
Team projects
3 team projects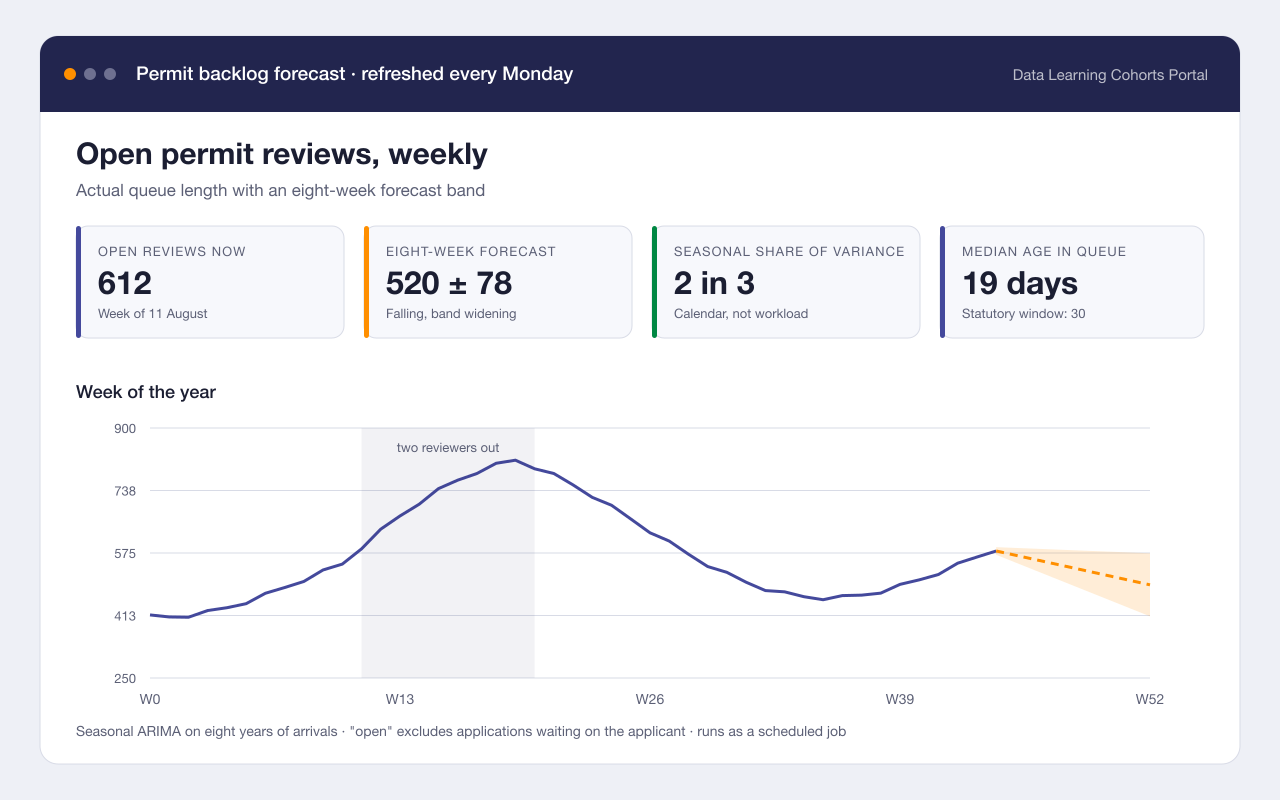
Forecasting the permit review backlog
Headline finding: A two-week staffing dip in March explained most of the backlog that was still there in July
Built a weekly forecast of the permit review queue so the licensing team can see a backlog forming instead of discovering it two months later.
- Time series
- Python
- 2 more methods & tools
Reading 1,800 survey comments without reading 1,800 comments
Headline finding: Three themes covered 71% of comments; cost was named twice as often as opening hours
Coded two years of open-ended community survey answers into a small set of themes, and published the codebook so the next survey can be compared with this one.
- Qualitative coding
- Python
- scikit-learn
- 1 more methods & tools
Last confirmed Sep 2025
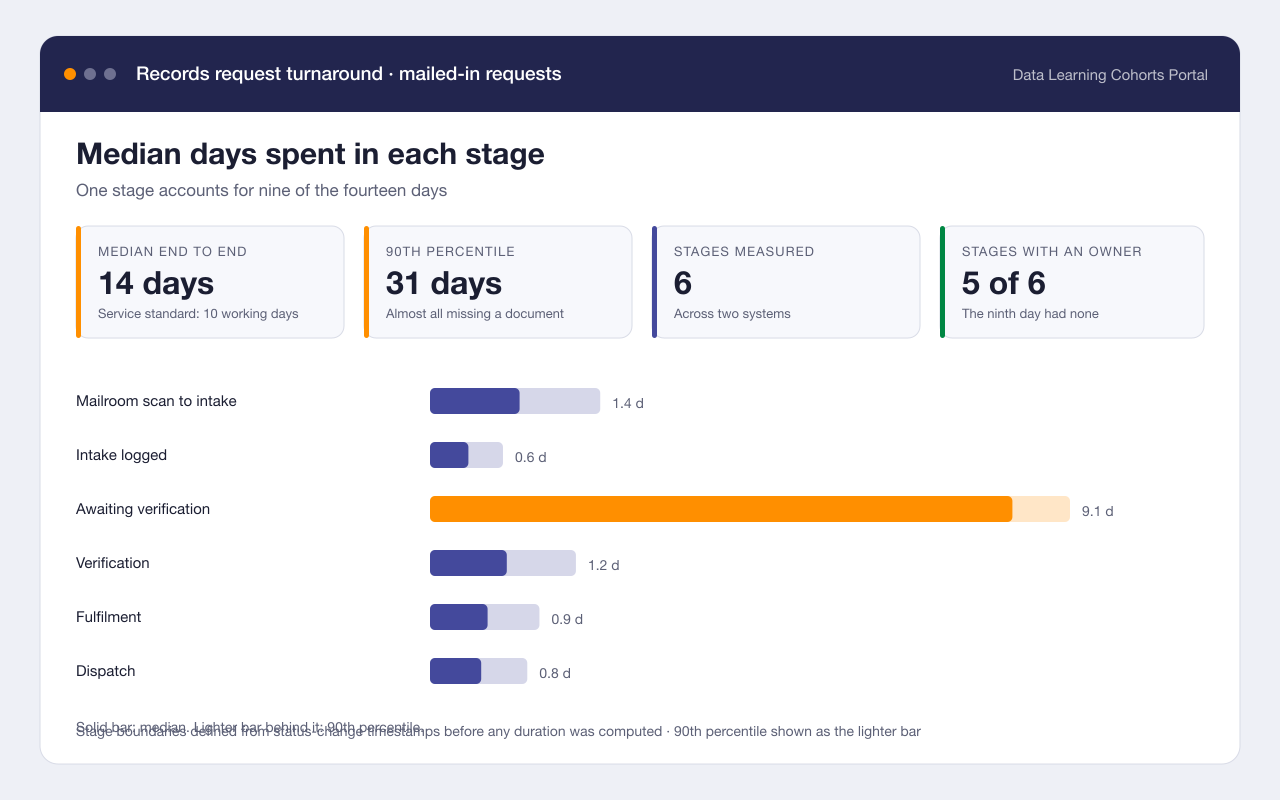
Where the two weeks go in a records request
Headline finding: Mail-in requests spent 9 of their 14 days in a single hand-off between two systems
Reconstructed the full path of a mailed-in vital records request from timestamps and found that most of the wait happened in a queue nobody owned.
- Process mining
- SQL
- 2 more methods & tools
Last confirmed Jun 2025
No matches
Nothing matches the current filters. Try clearing a filter or searching for a different term.