Data Learning Cohort 2026
Six months, three teams, one question each. Participants work a real question from their own area of work end to end, with a coach and a fixed set of milestones.
The 2026 cohort ran from January to June. Teams met monthly, worked through the scoping, analysis-plan and write-up clinics below, and published a project page by the end of June. Their work is presented at the September showcase, which is open to the whole organisation.
3 team projects of 3
Team projects
3 team projects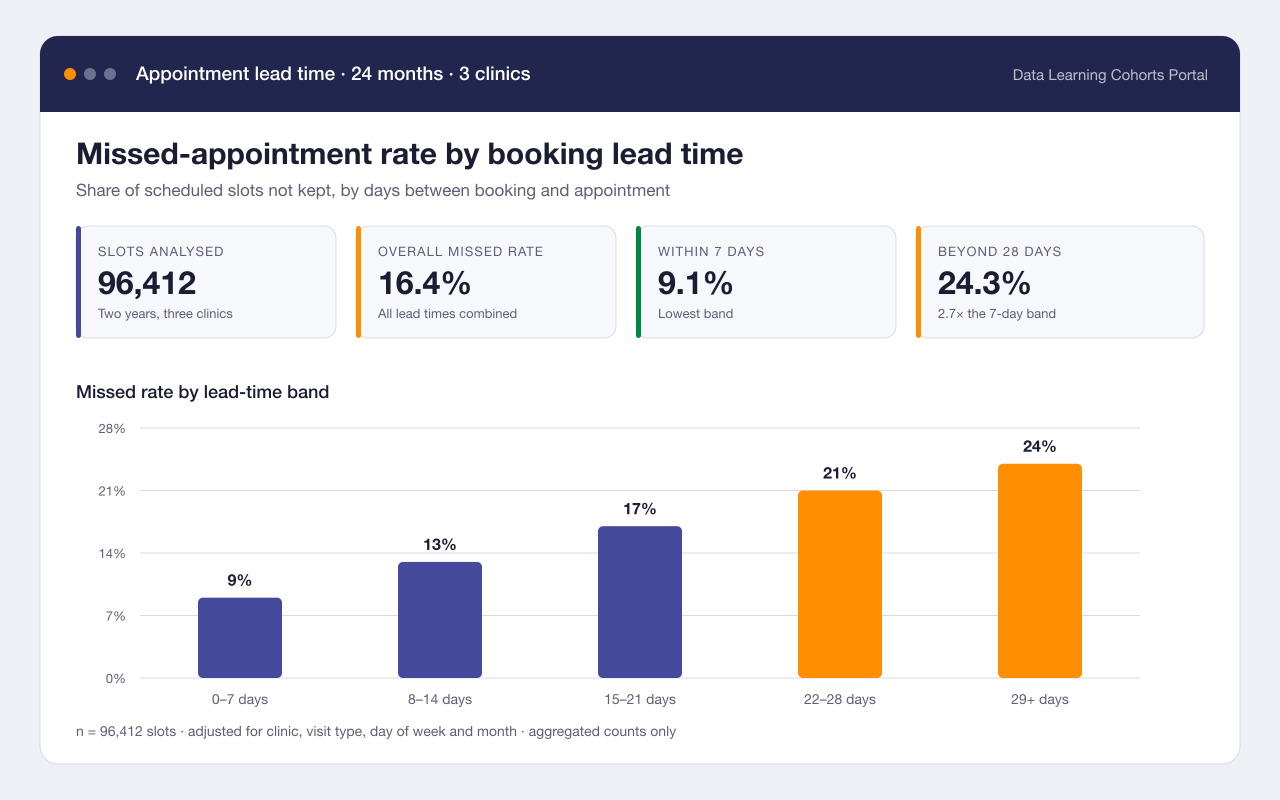
Booking lead time and missed appointments
Headline finding: Appointments booked more than three weeks out were missed almost twice as often as those booked within a week
Tested whether how far ahead an appointment is booked predicts whether it is kept, using two years of de-identified scheduling counts from three community clinics.
- Logistic regression
- R
- 2 more methods & tools
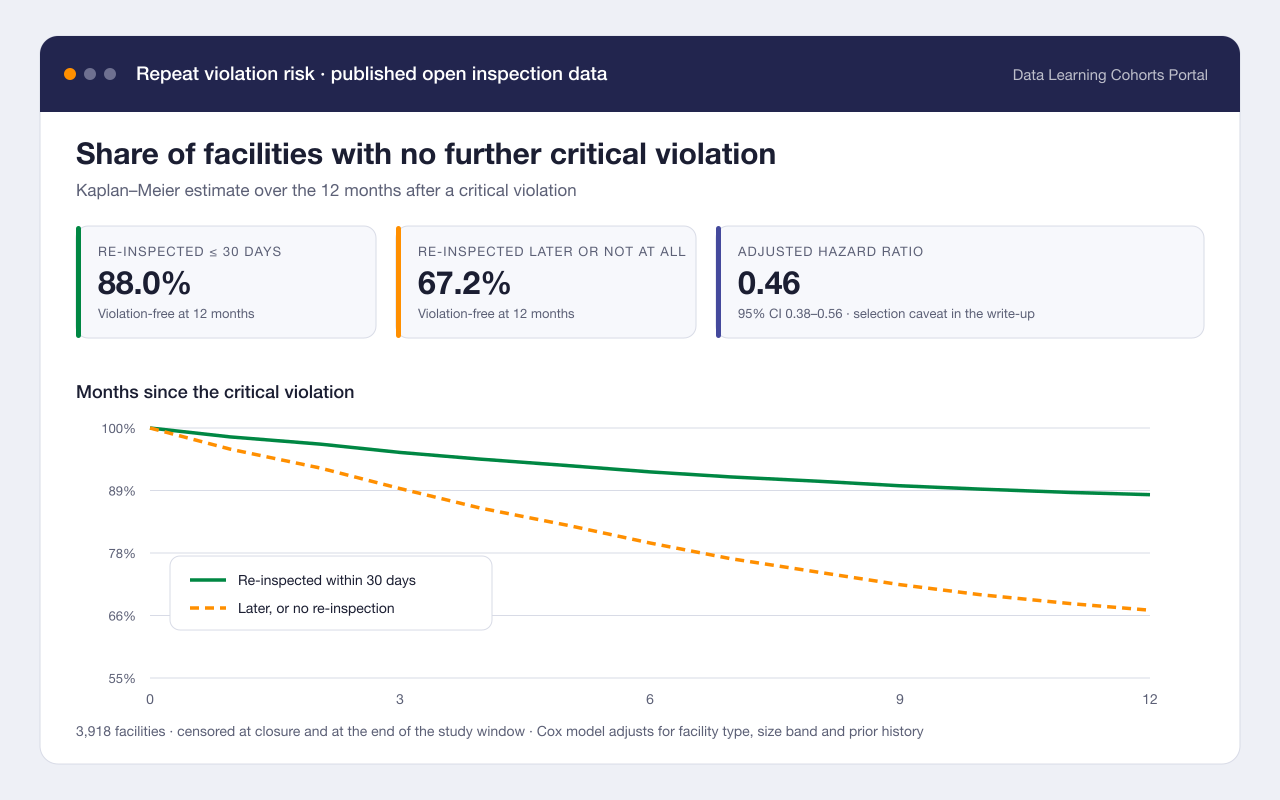
How soon does a critical violation come back?
Headline finding: A re-inspection within 30 days cut the one-year repeat rate from roughly one in three to one in eight
Measured how long facilities go after a critical inspection violation before the next one, and whether an early re-inspection changes that.
- Survival analysis
- Python
- 2 more methods & tools
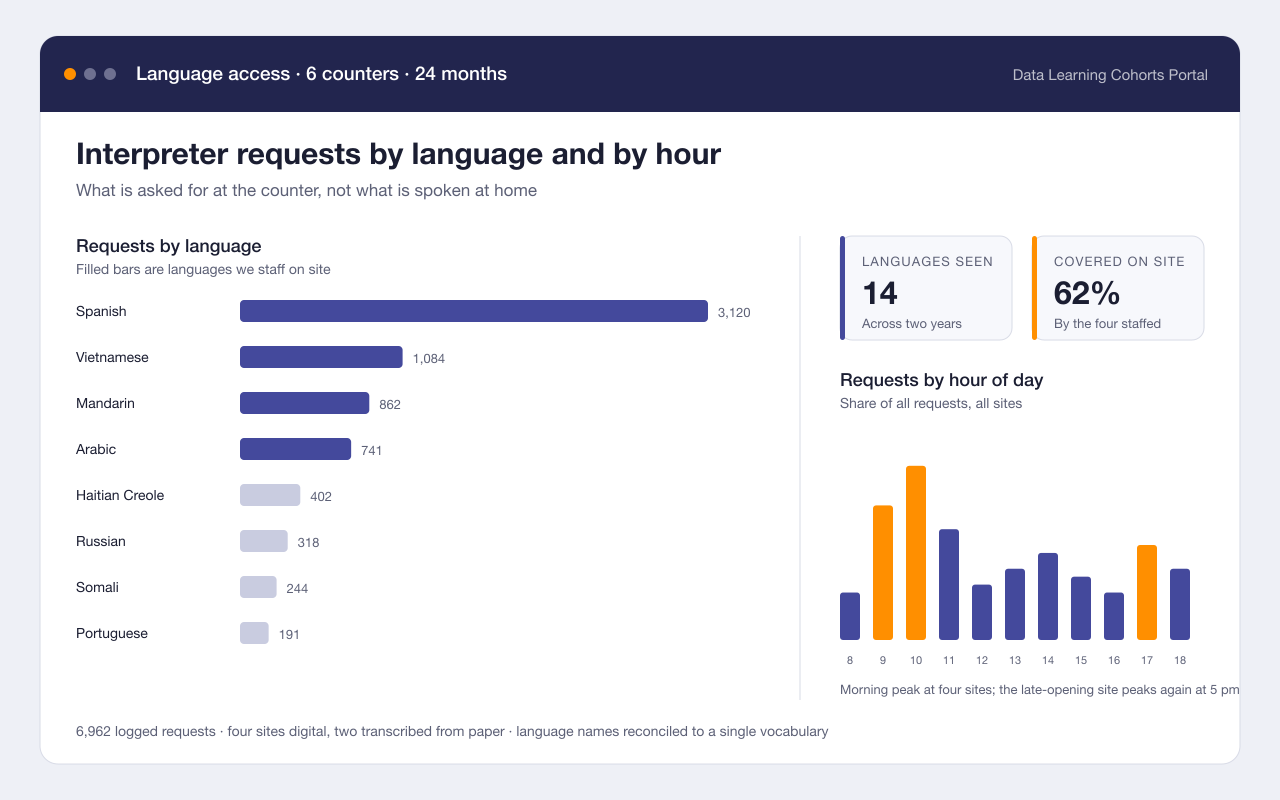
Which languages our front counters actually need
Headline finding: Requests named 14 languages; the four we staffed for covered 62% of them
Turned two years of interpreter request logs into a dashboard that shows which languages are asked for, at which counters, and at which hours.
- Tableau
- SQL
- 2 more methods & tools
No matches
Nothing matches the current filters. Try clearing a filter or searching for a different term.