Team projects tagged SQL
 Featured Storytelling
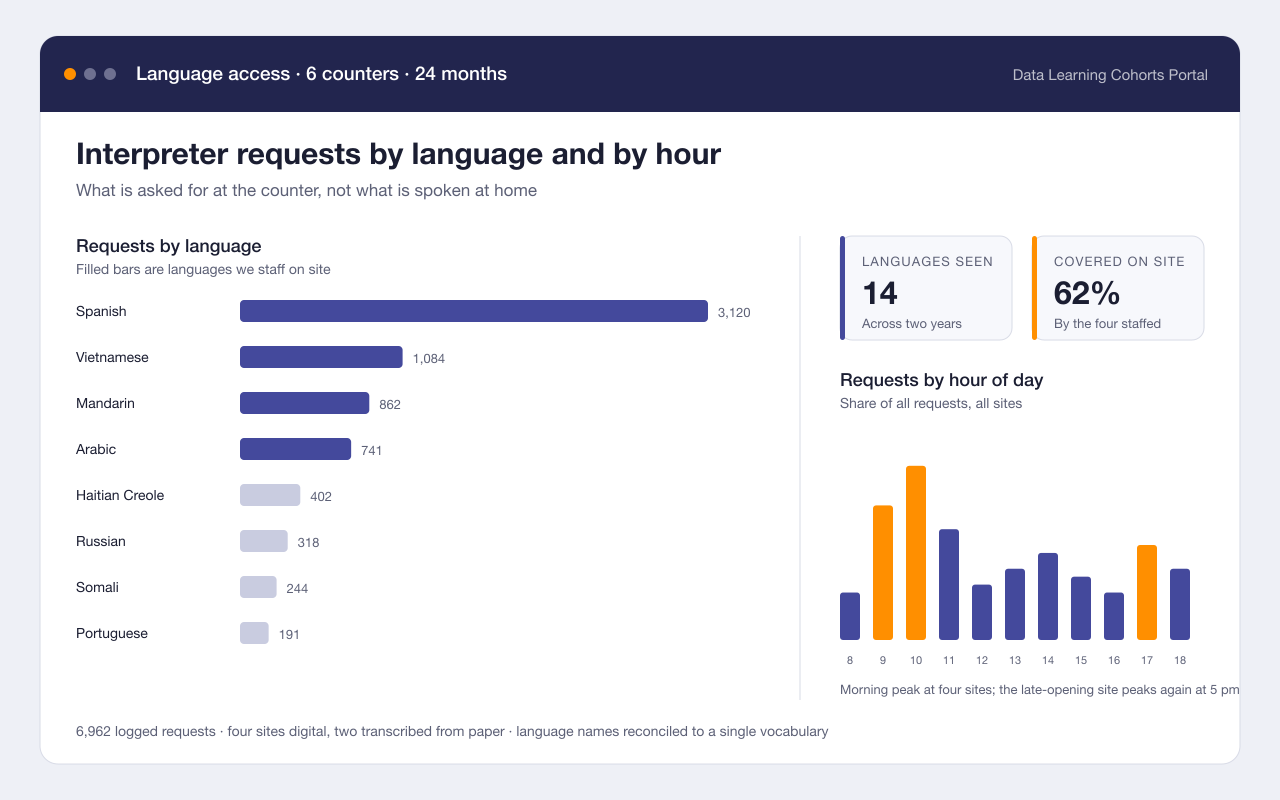
Which languages our front counters actually need
Headline finding: Requests named 14 languages; the four we staffed for covered 62% of them
Turned two years of interpreter request logs into a dashboard that shows which languages are asked for, at which counters, and at which hours.
- Tableau
- SQL
- 2 more methods & tools
Skills practiced: Visualization Skills practiced: Stakeholder interviews1 more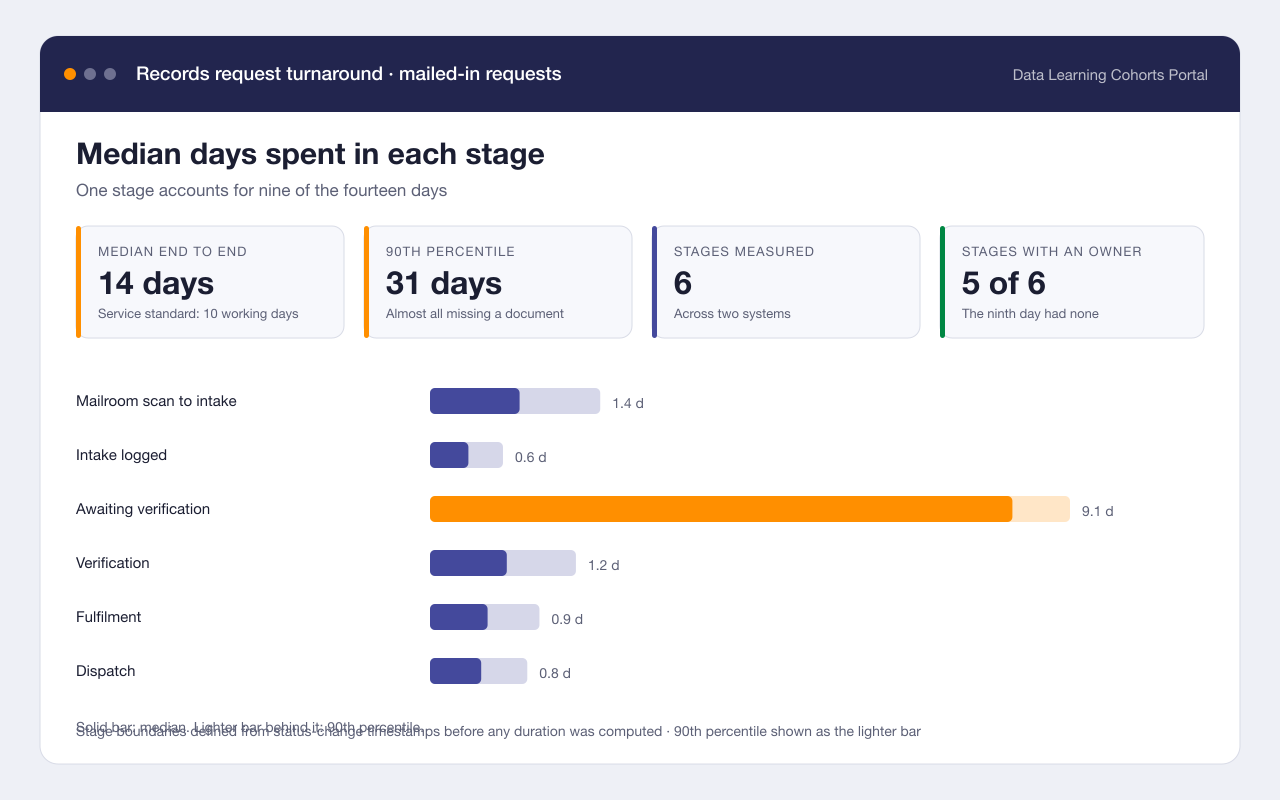 Civic
CivicWhere the two weeks go in a records request
Headline finding: Mail-in requests spent 9 of their 14 days in a single hand-off between two systems
Reconstructed the full path of a mailed-in vital records request from timestamps and found that most of the wait happened in a queue nobody owned.
- Process mining
- SQL
- 2 more methods & tools
Skills practiced: Data cleaning Skills practiced: Automation2 moreLast confirmed Jun 2025