Statistics
Testing whether an observed pattern holds up.
3 team projectsRefine these 3 in team projects →
Team projects tagged Statistics
 Featured Civic
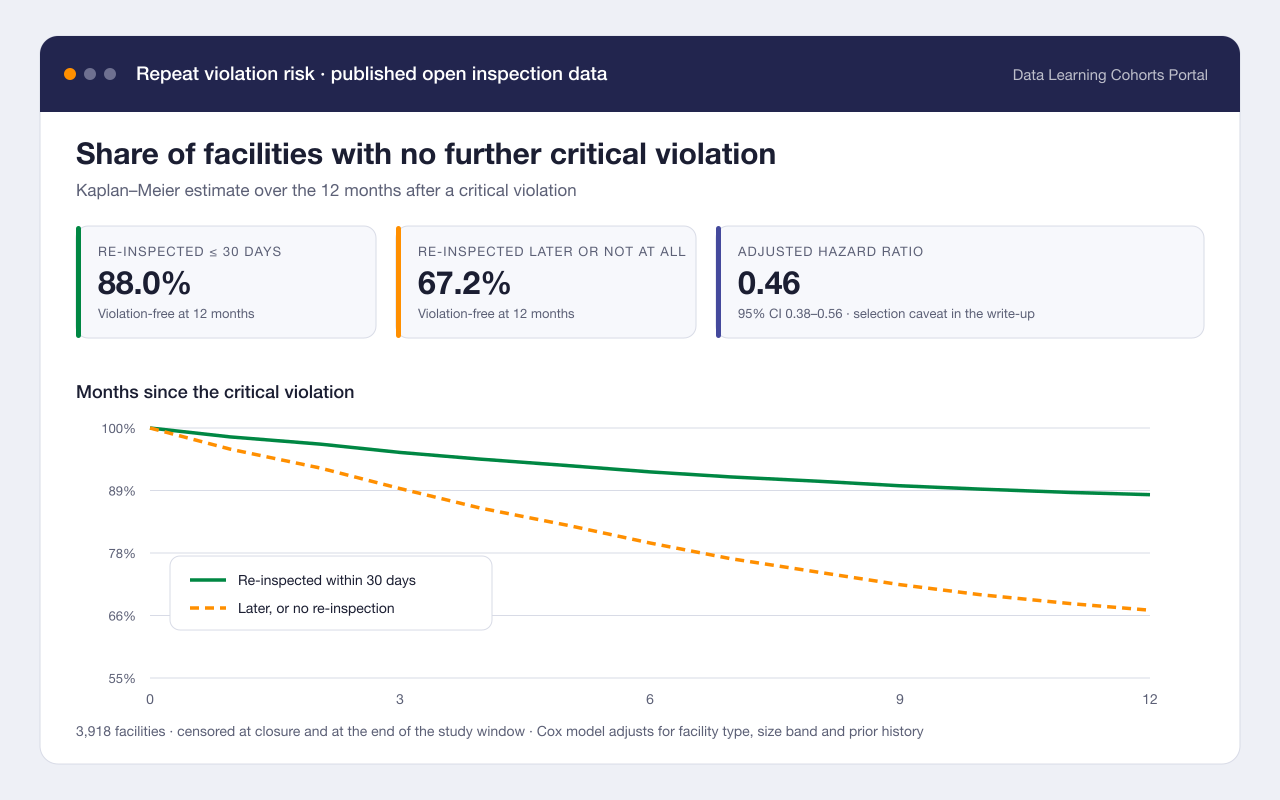
How soon does a critical violation come back?
Headline finding: A re-inspection within 30 days cut the one-year repeat rate from roughly one in three to one in eight
Measured how long facilities go after a critical inspection violation before the next one, and whether an early re-inspection changes that.
- Survival analysis
- Python
- 2 more methods & tools
Skills practiced: Statistics Skills practiced: Data cleaning1 more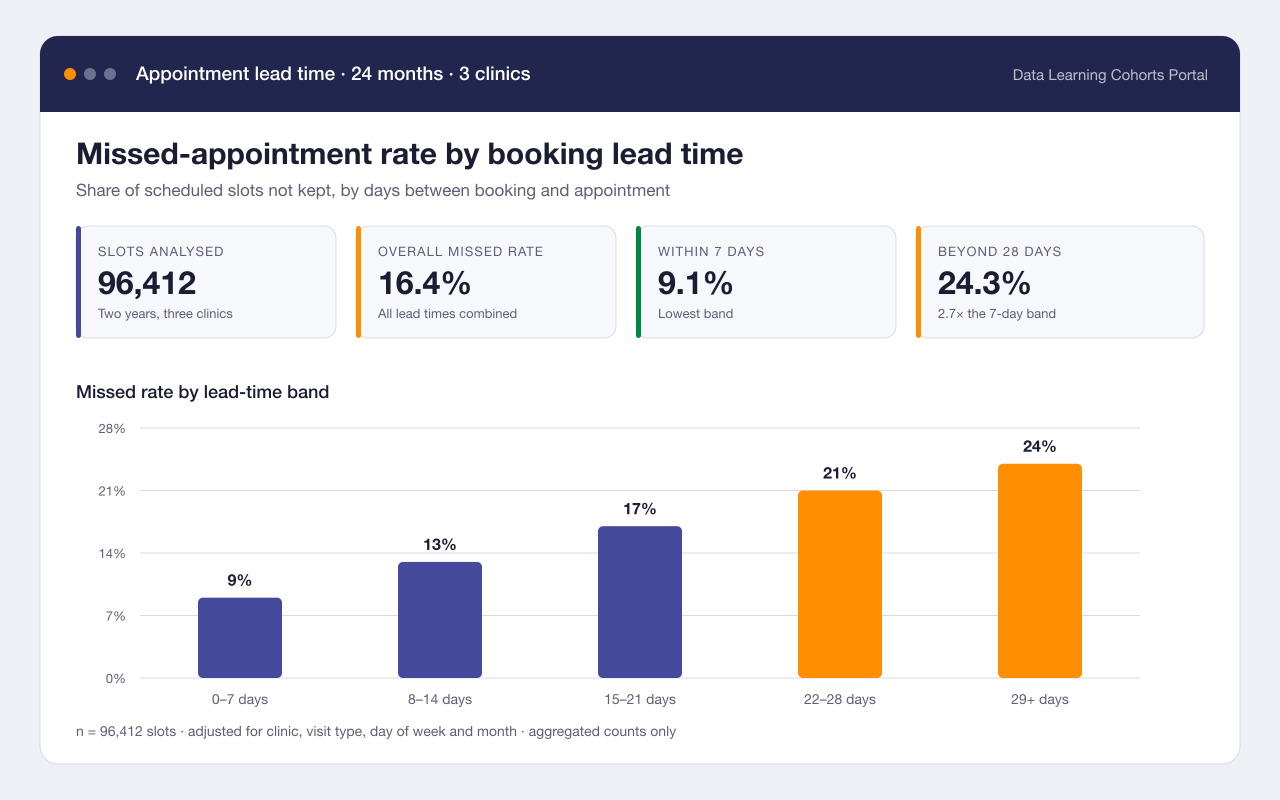 Essentials
Booking lead time and missed appointments
Headline finding: Appointments booked more than three weeks out were missed almost twice as often as those booked within a week
Tested whether how far ahead an appointment is booked predicts whether it is kept, using two years of de-identified scheduling counts from three community clinics.
- Logistic regression
- R
- 2 more methods & tools
Skills practiced: Data cleaning Skills practiced: Statistics1 more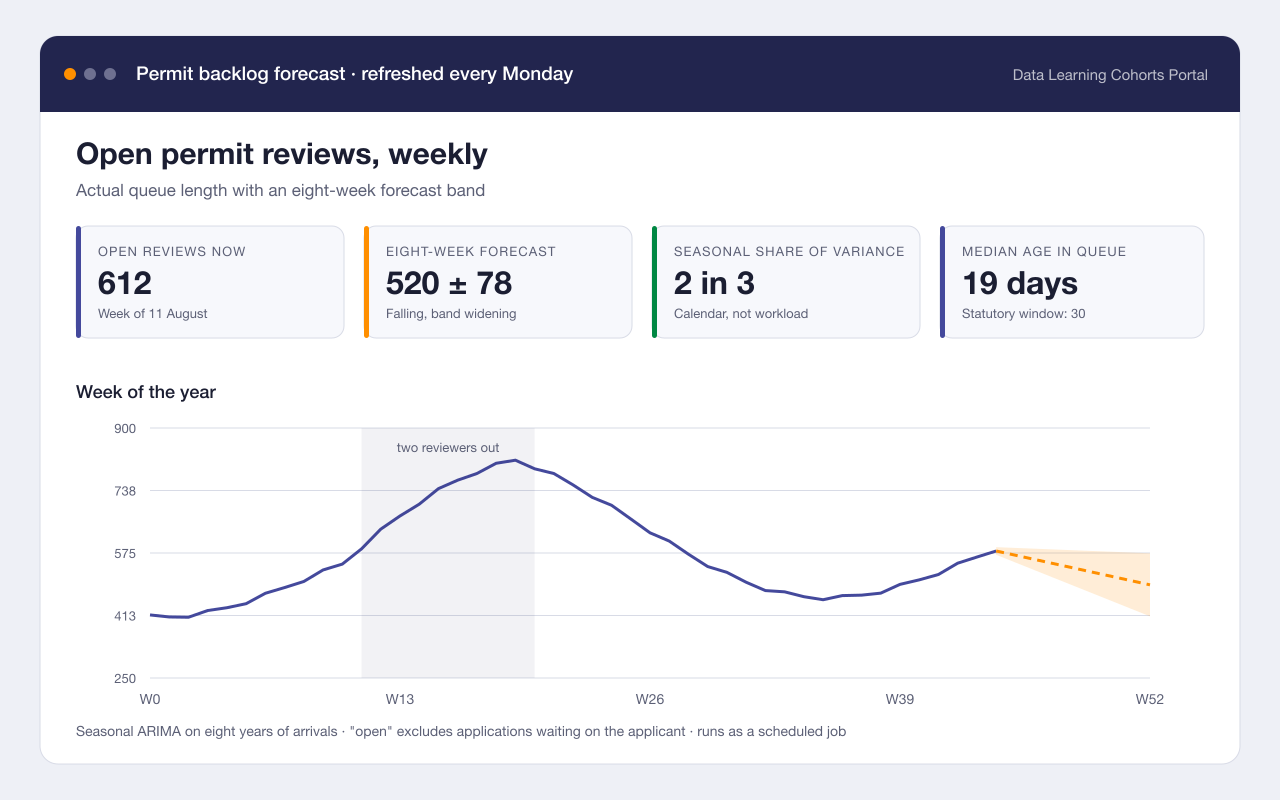 Essentials
Forecasting the permit review backlog
Headline finding: A two-week staffing dip in March explained most of the backlog that was still there in July
Built a weekly forecast of the permit review queue so the licensing team can see a backlog forming instead of discovering it two months later.
- Time series
- Python
- 2 more methods & tools
Skills practiced: Statistics Skills practiced: Automation1 more